
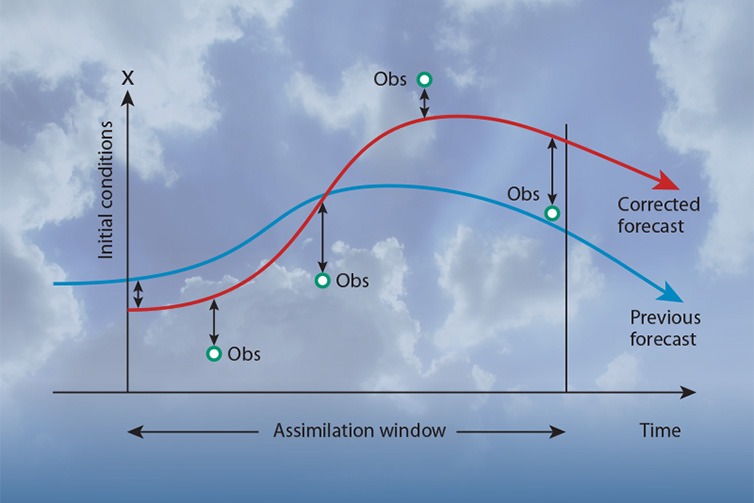
Twenty years ago ECMWF added an extra dimension – time – to the assimilation of observational data into weather models. This pioneering ‘4D-Var’ technique has led to substantial improvements in the Centre’s forecasts.
Developing a 4D variational data assimilation system was one of ECMWF’s biggest-ever projects. It culminated in the operational implementation of 4D-Var on 25 November 1997, less than two years after the introduction of 3D-Var.
A symposium to mark the 20th anniversary will be held at ECMWF on 26 January.
ECMWF Director-General Florence Rabier, ECMWF scientists Massimo Bonavita and Tony McNally, and Professor Olivier Talagrand explain how 4D-Var works and why it is so important for numerical weather prediction.
What is 4D-Var?
No matter how sophisticated our Earth system models may be, the quality of the forecasts they produce crucially depends on the accuracy of the initial conditions.
Using the model state from a previous forecast as an estimate of the initial conditions is not good enough: all forecasts come with errors, which grow over time.
A vital corrective is provided by weather observations.
Millions of them are made every day. They come from many sources, including satellites, aircraft, ground stations, ships, drifters and balloons.
However, on their own they cannot provide the initial conditions, either: they are unevenly distributed in space and time, and they too come with errors.
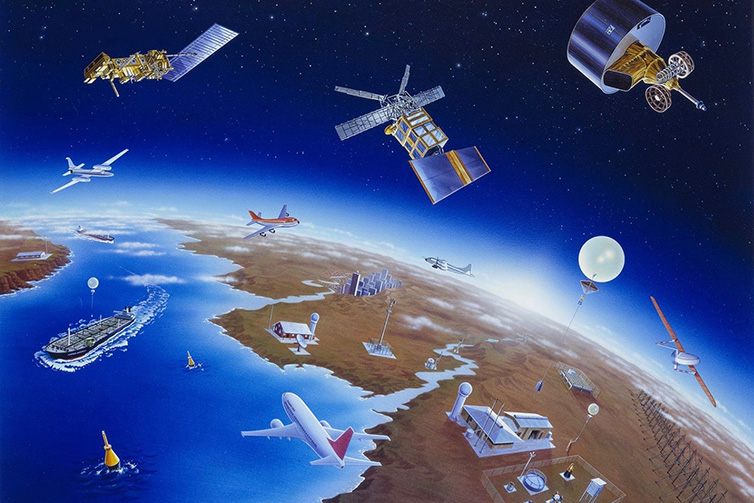
Weather observations come from many sources, but they cannot provide a complete picture of the state of the Earth system at a given point in time. (Diagram: WMO)
It takes the skilful combination of a short-range forecast with observations to produce the best possible estimate of the current state of the Earth system.
This process is called ‘data assimilation’. 4D-Var is a particularly sophisticated data assimilation method.
How does it work?
4D-Var adjusts a short-range forecast, called the background, in space and time to bring it into closer agreement with meteorological observations.
The quality and the structure of the observations are taken into account, as are the dynamics and the physics of the forecast model to ensure the observations are used in a meteorologically consistent way.
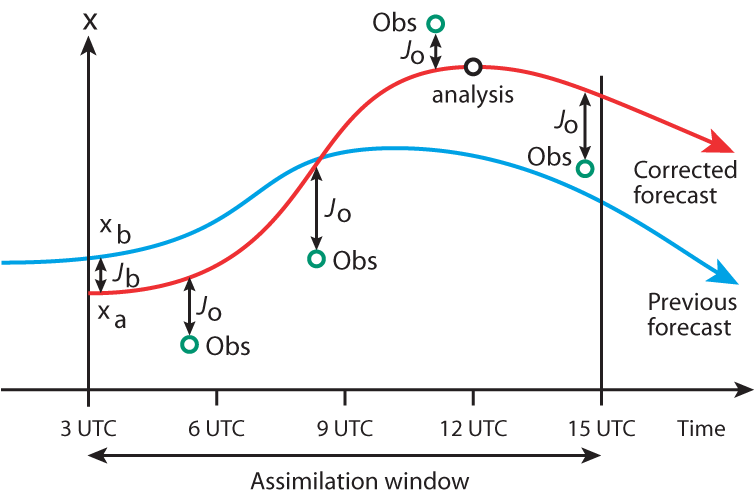
In the case illustrated here, for a single parameter x the observations are compared with a short-range forecast from a previous analysis over a twelve-hour assimilation window. The model state xb at the initial time is modified to achieve a statistically and dynamically based good compromise xa by minimizing a penalty function. The most important penalty terms are Jb representing the fit to the previous forecast xb, and Jo representing the fit to all the observations within the assimilation window.
“Effectively we’re running a dynamical model forward and backward in time, extracting the information from all the observations made over the course of 12 hours and iterating a number of times to determine how we need to change the state at the start to achieve better agreement with those observations,” ECMWF scientist Lars Isaksen says.
Since the 12-hour short-range forecast tends to be very accurate, typically only small adjustments are needed, such as changes in temperature by one degree at most and small shifts in the position of weather systems.
What benefits does it bring?
Results obtained with 4D-Var quickly showed a dramatic improvement in forecast quality.
Continued enhancements of the 4D-Var system over the last 20 years have improved forecasts further.
Many new types of observations have been introduced, and the number of observations has increased by nearly two orders of magnitude.
An important step was the introduction in 2011 of an ensemble of lower-resolution 4D-Var analyses to provide flow-dependent background uncertainty information.
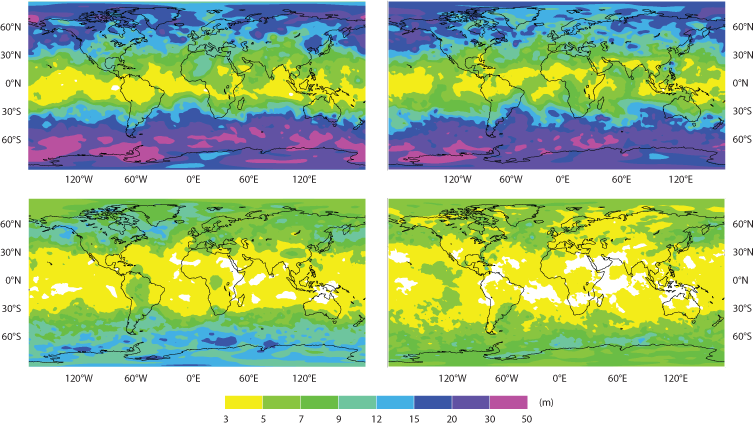
The charts show the root-mean-square error for 24-hour forecasts of 500 hPa geopotential height in ECMWF’s operational assimilation system for the month of October 1997 with 3D-Var (top left), October 1998 with 4D-Var (top right), October 2007 with 4D-Var (bottom left), and October 2016 with 4D-Var and the Ensemble of Data Assimilations (EDA).
4D-Var works particularly well with satellite observations.
For a start, the variational method enables the direct use of satellite measurements, which greatly increases the value of the data.
ECMWF has been leading research efforts to extract meteorologically useful information from satellite data. For example, it is challenging to use satellite measurements near the Earth’s surface and in cloudy and rainy conditions.
What is more, 4D-Var is particularly well-suited to satellite data because of the way the data are spread out across time as well as space.
“There have been big improvements in accuracy and much more uniform forecast quality across the globe. In particular, we've had large improvements in the southern hemisphere, where there are fewer weather stations but the same amount of satellite data as everywhere else,” says ECMWF Director-General Florence Rabier, who played a key role in the implementation of 4D-Var at the Centre.
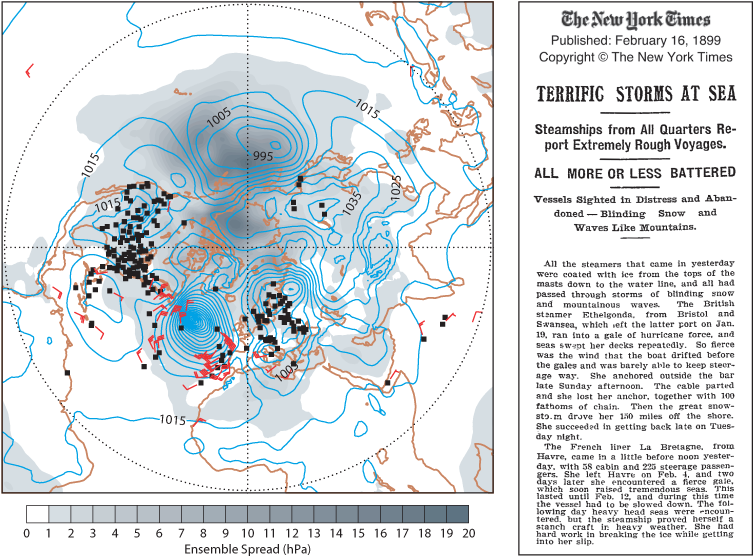
The power of 4D-Var to fill gaps in observations is demonstrated by a reanalysis of a storm in the Atlantic. The map shows the ERA-20C reanalysis of surface pressure (hPa) at 12 UTC on 3 February 1899 in the northern hemisphere (blue contours). The locations of all surface observations used are indicated by black dots (surface pressure) and red vanes (10-metre winds). The grey shading indicates error estimates for the reanalysis. A New York Times article published on 16 February 1899 describes the severity of the storm.
What does the future hold?
The 4D-Var technique is being developed in a number of directions at ECMWF.
“We currently run separate data assimiliations for different components of the Earth system, such as the atmosphere, the ocean and the land surface,” Dr Rabier says.
“The ultimate goal is to perform coupled data assimilations where we assimilate observations of all these different components together within a 4D-Var context.”
In parallel, work is under way to implement a new 4D-Var data assimilation framework for ECMWF’s Integrated Forecasting System (IFS).
The framework, called OOPS (Object-Oriented Prediction System), will bring a number of benefits.
In particular, OOPS-IFS will make it easier to develop and test alternative algorithms, and it will provide a common framework for the development of coupled data assimilation.
Initial tests of OOPS-IFS have been encouraging and the target is for it to be operational in 2019.
