
Timely warnings, backed up by tenacious policing of the public’s response, helped avert a major humanitarian disaster in Sardinia when devastating flash floods hit on 28 November 2020. This was probably the worst rainfall event in Sardinia since the deadly floods of November 2013, which had led to major policy changes.
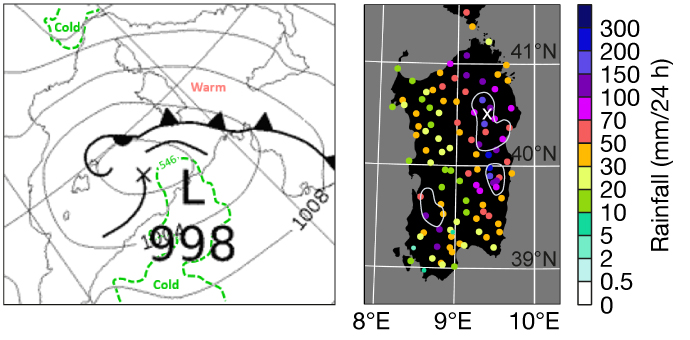
Synoptically, the 2013 and 2020 events were strikingly similar. Both times, in the preceding days, a pool of cold air transferred eastwards across northern Africa, with a surface cyclone developing on the northern flank, along with an attendant inverted cold front. The primary rainfall source was then the warm, moist, unstable south-easterly flow ahead of that front, which impinged on Sardinia’s complex and often steep topography (see synoptic setting and observation charts).
Medium-range forecast guidance
ECMWF’s primary warning tools for such events are the EFI (Extreme Forecast Index) and SOT (Shift of Tails) for 24‑hour rainfall. These aim to give advance warning of events that may be climatologically extreme at the model grid scale. In this case there were very useful signs of possible extremes as much as six days in advance, with more clarity developing as the event approached. Eastern Sardinia was signified to be at greatest risk (see EFI forecasts).
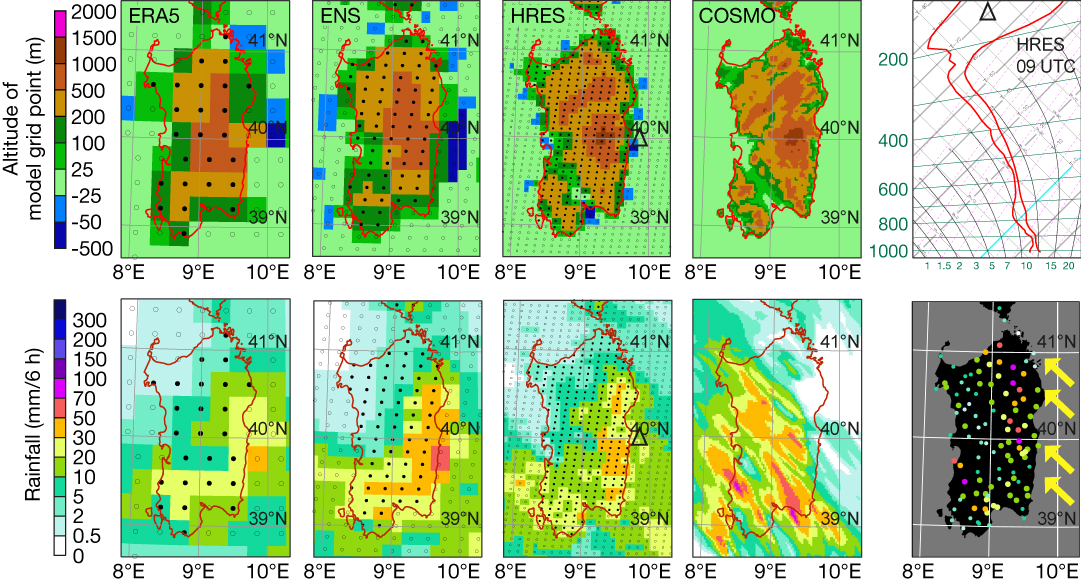
Whilst broadscale predictions and non-dimensional EFI-type output continue to be fundamental products for ECMWF’s user base, nowadays users also expect accurate forecast values. However, models with parametrized convection, such as ECMWF’s high-resolution forecast (HRES) and ensemble forecast (ENS), and indeed the ERA5 reanalysis, cannot and should not be expected to represent the very localised and flash flood-related high rainfall totals that can occur during convective outbreaks.
Model output issues
To gauge potential shortfalls, and also investigate and compare systematic resolution-dependent biases, one can assume that, at very short ranges, forecasts from particular systems will have migrated asymptotically towards the predictive skill ceilings that are innate to those systems. Unsurprisingly, the maximum rainfall forecast varies inversely to resolution, with ERA5, ENS Control and HRES here ‘underpredicting’ observed peaks, at land grid points, by about 75, 65 and 50% respectively (allowing for some location errors – see the forecast and observation figures). Also apparent is an increasing tendency, with larger grid-lengths, for the largest totals to shift eastwards, away from land to sea-based grid points. This might seem surprising given that topographically forced ascent is a strong convective trigger in ECMWF models. However, because topography must be spectrally fitted, near-coast sea grid points can be well above or well below sea level, creating artificial ‘marine hills’ that can apparently trigger convection. This is most apparent here in the Control run, where peak totals are near the real east coast where the model sea ‘rises up’ quite abruptly. This is also indicative of another factor contaminating IFS forecasts, namely no convective life cycle: where convection is triggered, rain immediately falls, leading to systematic biases on the grid scale. These inferences are strongly supported by analysis of ensemble mean fields (see: https://confluence.ecmwf.int/display/FCST/202011+-+Rainfall+-+Sardinia). The keen forecaster referencing grid point values (e.g. on meteograms) will benefit greatly from understanding these various modelling issues.

Convection-resolving model and datasets
In reality, the largest 6‑hour totals were inland, mostly in elevated regions, whilst eastern near-coast sites saw more modest amounts. The convection-resolving COSMO (Consortium for Small-scale Modelling) model captured this distinction much better, and extremes were of the right order. However, in any one member peaks were not all correctly located, and near-coast rainfall was insufficient, perhaps because of other model issues (see the COSMO panels in the rainfall forecast figure). To reach these instructive conclusions, and indeed for real-time monitoring, high density observations are essential. Whilst the Agenzia Regionale per la Protezione dell’Ambiente della Sardegna (ARPAS) provides one such set, separate initiatives (such as Sardegna Clima: https://www.sardegna-clima.it/) are increasingly providing additional real-time datasets to exploit around the world.
EFI issues
The absence of coastal maxima, which were consistently predicted in ENS members at shorter ranges, suggests that the EFI and SOT fields discussed above may have been contaminated by systematic errors. The explanation would be mixing up of differing weather-type-dependent biases, which is a minor weakness of the EFI approach.
Post-processed products
To try to address these various resolution and formulation-related issues, and thus to deliver more accurate forecasts of values for users, one can post-process and blend model output in different ways. This is done in the MISTRAL project (Meteo Italian Supercomputing Portal), which uses ECMWF and COSMO ensembles (also in this Newsletter). Probabilistic output thus derived can provide for forecasters a ‘reasonable worst-case scenario’ at a user-selected point probability level (see MISTRAL charts). Whilst raw model outputs may not always reach the basic performance level needed for post-processing to add value (as was the case for northeast Sardinia here), overall MISTRAL products did provide reasonable guidance regarding maximum rainfall values for this case.

Outlook
ECMWF’s Strategy to 2030 includes the goal of delivering convection-resolving ensemble output at global scales. This article demonstrates some of the benefits and challenges that can lie ahead.