
This fire burnt in western Greenland just north of the Arctic Circle on 10 July 2019, as observed by the US Landsat 8 satellite. (NASA/Visible Earth)
Unusually high levels of wildfire activity within the Arctic Circle monitored since the second week of June 2019 have continued well into August, data from the EU-funded Copernicus Atmosphere Monitoring Service (CAMS) implemented by ECMWF show.
Many of the fires have burnt in Siberia, Alaska and northern Canada, but there has also been some wildfire activity in Greenland. Environmental impacts include air pollution resulting from exceptionally high levels of emissions, and potential climate feedbacks.
Sustained fire activity
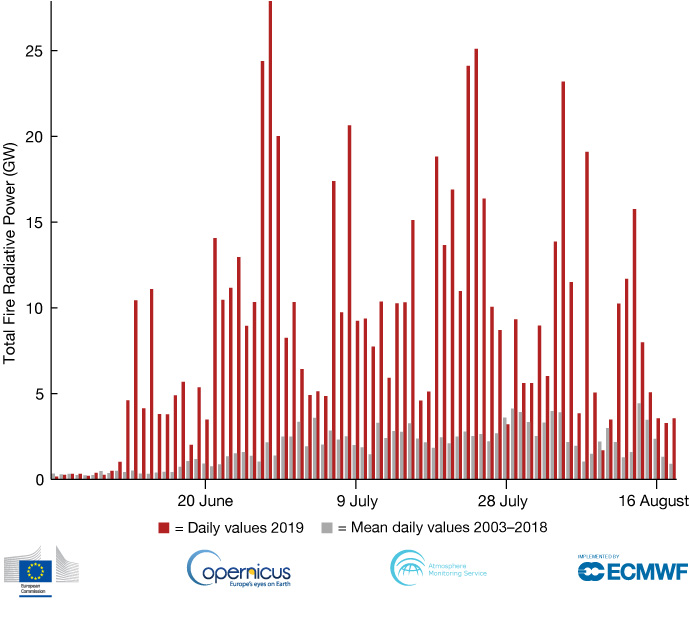
“With a couple of exceptions, every day since 9 June the total radiative power from wildfires within the Arctic Circle has been above average compared to the last 15 years,” says ECMWF scientist Mark Parrington. “This makes the summer of 2019 an exceptional wildfire season for the area.”

CAMS data show that the daily radiative power from wildfires within the Arctic Circle has been above average almost every day this summer. On some days, such as 28 June, it was more than ten times the average value for the years 2003–2018. (Data source: CAMS Global Fire Assimilation System)
The increased wildfire activity comes at a time of unusually high temperatures and dry conditions in parts of the Arctic. For example, in June 2019 temperatures in parts of northern Siberia were nearly 10°C warmer than the 1981 to 2010 average.
“In these conditions, it is easier for wildfires to grow and to be more long-lived,” Mark notes.
From Siberia to Greenland
A map of total fire radiative power from 1 June to 18 August 2019 shows extensive clusters of fires in Siberia, including many in the Arctic Circle. “Fires have also been widespread in Alaska and Canada, with above-average wildfire activity this summer also south of the Arctic Circle in many cases,” says Mark.

Map of total radiative power from 1 June to 18 August 2019. The blue dashed line marks the location of the Arctic Circle. (Data Source: CAMS Global Fire Assimilation System)
Unusually, there has also been some wildfire activity in western Greenland, just north of the Arctic Circle. “This has been on a much smaller scale than the fires seen elsewhere in the Arctic, but it is rare to see any such activity in Greenland at all,” Mark notes.
Environmental impacts
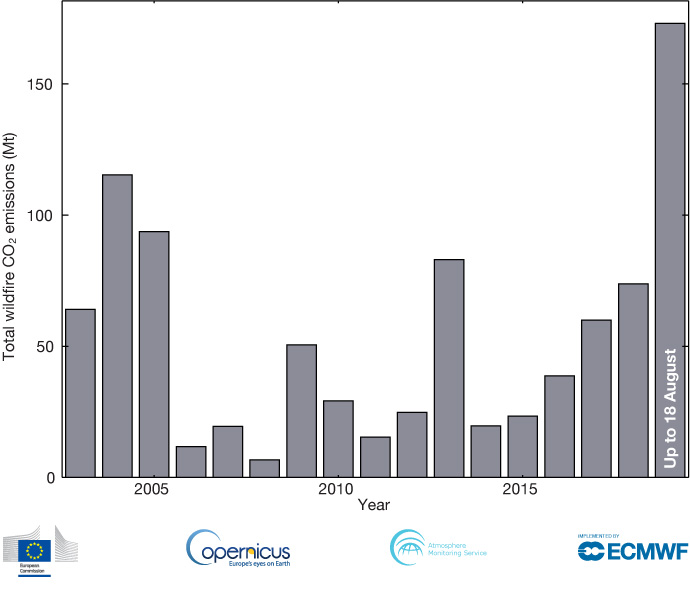
By mid-August, 2019 estimated wildfire emissions of CO2 within the Arctic Circle had surpassed 150 megatonnes. That is much more than the total annual amount in any other year since 2003.

The chart shows the annual total estimated wildfire CO2 emissions in the Arctic Circle between 2003 and 2018 and the 2019 total up to 18 August. (Data source: CAMS Global Fire Assimilation System)
CO2 is one of 40 different constituents of smoke estimated with the CAMS Global Fire Assimilation System (GFAS). It reflects the intensity of the fire activity and enables comparisons with annual reported fossil fuel emissions for different countries.
For example, the estimated amount of CO2 released into the atmosphere from Arctic wildfires this year so far is more than three times Sweden’s total annual emissions.
Other constituents of smoke include particulate matter, which may settle on snow or ice, and pollutants that can affect air quality. These impacts may occur near the fires or up to thousands of kilometres downwind.
There are also potential climate feedbacks. “Particulate matter settling on snow or ice can lead to sunlight being absorbed rather than reflected,” Mark points out. “In addition, some of the CO2 released in the fires, for example from burning peat, may not be reabsorbed in future regrowth. Any net emissions will contribute to global warming.”
