
The climate in Europe in 2022 was marked by extreme heat and widespread drought, according to a report published by the EU-funded Copernicus Climate Change Service (C3S) implemented by ECMWF.
The European State of the Climate report (ESOTC 2022) finds that Europe experienced a summer that was 0.3–0.4°C warmer than the previous warmest summer, and that high temperatures and a lack of precipitation contributed to significant drought.
It also reports that, globally, 2022 was the fifth warmest year on record, and Greenland’s ice sheet experienced record melt.
Extreme heat in Europe
2022 was the second warmest year on record for Europe, and for some countries in southwestern Europe it was the warmest on record.

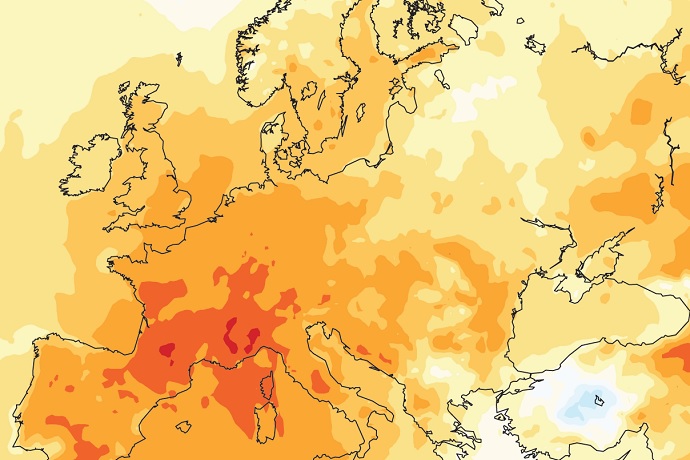
Average surface air temperature anomaly for 2022, relative to the 1991–2020 reference period. Data source: ERA5. Credit: C3S/ECMWF.
During summer, much of Europe was affected by exceptional heatwaves. The highest temperatures in western Europe were about 10°C warmer than typical summer maximum temperatures. Southern Europe saw a record number of days with ‘very strong heat stress’.
At 1.4°C above average, summer was the warmest on record, and it was 0.3–0.4°C warmer than the previous warmest summer in 2021.
The fact that European temperatures in summer reached record levels can be seen in a chart that shows temperature anomalies since 1950.

European land surface air temperature anomalies for summer (JJA) 1950–2022, relative to the average for the 1991–2020 reference period. Data source: ERA5, E-OBS. Credit: C3S/ECMWF/KNMI.
Below-average precipitation
In terms of precipitation, the year was 10% drier than average in Europe, and soil moisture conditions were the second lowest in the last 50 years.
Europe’s rivers saw the driest year on record in terms of the area affected, with 63% experiencing below-average flows.

Monthly average river discharge anomalies for August 2022. The categories ‘exceptionally high (low)’, ‘notably high (low)’, ‘above (below) average’ and ‘near average’ range relate to the percentile ranges >90 (<10), 75–90 (10–25), 60–75 (25–40) and 40–60 for the 1991–2020 reference period. Shades of blue indicate higher, and shades of red indicate lower discharge than normal, respectively. Grey indicates near-average discharge. Only rivers with drainage areas greater than 1,000 km2 are shown. Data source: EFAS. Credit: Copernicus EMS/ECMWF.
Fifth-warmest year globally
Globally, 2022 was the fifth warmest year on record, and the last eight years were the warmest on record.

Annual average surface air temperature anomaly (°C) for 2022, relative to the 1991–2020 reference period. Data source: ERA5. Credit: C3S/ECMWF.
2022 was the warmest year on record for several regions of the globe, including much of western Europe, parts of northwestern Africa, the Horn of Africa, central Asia and China, and much of the south Pacific. The most-below-average temperatures over land were in southeastern Australia and central Canada.
A series of atmospheric rivers delivered exceptional heat and rainfall to Greenland. These atmospheric rivers resulted in three heatwaves, with record September average temperatures up to 8°C above average.

September 2022 temperature anomalies, relative to the average for the 1991–2020 reference period. Data source: ERA5. Credit: C3S/ECMWF.
The extreme heat, combined with rainfall during a time of year when precipitation would normally fall as snow, led to record ice sheet melt, with around a quarter of the ice sheet (442,000 km2) under surface melt on 3 September.
The latest five-year average global temperature is almost the highest on record. In recent decades, temperatures over land have risen around twice as fast as those over oceans.
Temperatures over the Arctic have risen much more rapidly than those over most of the rest of the globe, with an estimated warming of around 3°C since the 1970s.

Global sixty-month average surface air temperature (°C). Data source: Six temperature datasets covering all or parts of 1850–2021. Credit: C3S/ECMWF.
The full ESOTC 2022 report, which covers all aspects of the European and global climate in 2022, is available on the C3S website, together with a summary of the main findings.
The top image shows the average surface air temperature anomaly for 2022, relative to the 1991–2020 reference period. Data source: ERA5. Credit: C3S/ECMWF.