
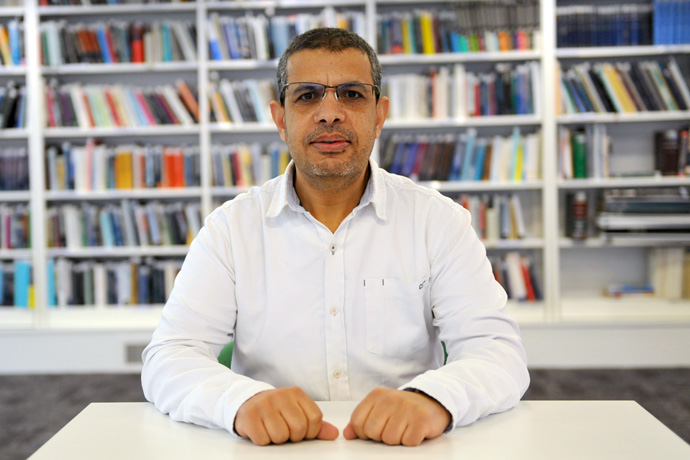
Numerical weather predictions rely on observations to help establish the initial conditions of forecasts as accurately as possible. Mohamed Dahoui monitors weather observations at ECMWF to ensure they are of good quality.
These observations are then used, together with a short-range forecast constrained by previous observations, to obtain the best possible estimate of the current state of the Earth system. This process is called Earth system data assimilation, and the result is known as the analysis.
“My interest in meteorology grew while I visited the Hassania school of public engineering in Casablanca, Morocco, in the nineties,” Mohamed says. “The country was establishing a meteorological research centre and a supercomputing facility at the time. This gave rise to a lot of international cooperation in research and training, which attracted me.”
After graduating from Hassania and the National School of Meteorology in Toulouse, France, he became a meteorological engineer at the Moroccan Meteorological Service. He subsequently obtained a PhD in satellite data assimilation in Toulouse.
After working in Morocco in marine forecasting and as a manager of the observing system infrastructure, Mohamed joined ECMWF in 2008. Since then, the number of satellite sensors monitored at ECMWF has gone up considerably.

The number of satellite sensors monitored operationally at ECMWF between 1996 and 2023 has gone up significantly. The colours represent families of observations.
Checking the quality of observations
At ECMWF, Mohamed first monitored just satellite observations, but soon his field of action was extended to all Earth system observations coming into the Centre.
These observations are very dynamic. They are continuously subject to various ‘data events’ that may make them unsuitable for establishing the initial conditions of weather forecasts.
Mohamed’s role is to detect and deal with such events. “Robust and timely monitoring of all observations is necessary,” he says. “We can then compute a wide range of observation monitoring statistics for the benefit of internal and external users, and to provide valuable feedback to data providers.”

These images show snow depth in mid-October 2021 while using observations affected by gross errors (top left), and snow depth after those observations were removed (top right). In this instance, the error was caused by observations that included cut hay, which was erroneously thought to be snow (bottom left). They were found to be wrong when satellite data for the same area and period were consulted (snow cover converted to snow depth – bottom right).
In particular, Mohamed looks at differences between observations and short-range forecasts to identify any observation anomalies.
Any such departure statistics must be interpreted with great care. “Large departures could be due to faulty observations or wrong metadata, but they could also be due to inaccuracies in the short-range forecasts, or there could be errors in translating those forecasts to the quantities observed,” Mohamed says.

This image shows wind increments (arrows) at 12 UTC on 27 April 2022. It indicates an unwanted adjustment of wind in the Indian Ocean, which turned out to be the result of an Indian radiosonde being given the wrong location for its measurements. This problem was identified by analysts as part of Forecast Daily Report duties.
All significant data events are recorded. There were, for example, more than 40 in 2022. A decision is then taken what to do about those data.
The observation monitoring system also has to be updated regularly to bring in new observations, including new types of observations.
“I cooperate with researchers who are investigating whether new types of observations can be added to those already used,” Mohamed explains. “I develop tools that will automatically generate the required statistics for their experiments.”
Machine learning to detect anomalies
Anomaly detection has long relied on automatic tools to warn ECMWF scientists if something seems to be wrong with observations. But sometimes existing tools can be unreliable when assigning severity levels. This can lead to unnecessary investigations or sometimes to events being ignored.
Existing tools are not equipped to differentiate between observation problems and events caused by other components of the data assimilation system, either.
“Machine learning techniques can improve the anomaly detection through a better detection of patterns, and they can improve the classification of events by severity and cause,” Mohamed says.
He has developed a machine learning tool to detect and classify observation anomalies. This is due to be implemented later this year after further testing.

Time series of scaled standard deviation of observations minus first-guess forecasts (background departures) for AMSU‑A channel 11 on Metop-B satellite over the tropics. Actual statistics are shown in red, statistics predicted by the new machine learning tool are shown in blue. Actual statistics are clearly abnormal compared to the expected behaviour.
The Forecast Daily Report
In addition to monitoring observations, ECMWF performs routine internal monitoring of ECMWF’s analyses and forecasts. This includes checks of observation usage and availability, data assimilation, forecast evolution and ECMWF graphical forecast products.
Mohamed is part of a team of analysts who take it in turns on a weekly basis to carry out this work.
The process involves the checking of a wide range of diagnostics. Of particular importance is the forecast performance for severe events, such as heavy rainfall, high winds, or exceptional temperatures. Feedback from Member State users is also analysed.

For 20 December 2022, ECMWF’s ensemble forecasts (ENS) for Reading, UK, predicted higher than normal temperatures long in advance. The chart shows the evolution of ENS and high-resolution forecasts (HRES) for 2 m temperature, all valid for that day. The climatological distribution is shown by the red box-and-whisker symbol. By nearly ten days in advance, the temperatures predicted by ENS are elevated, as are those predicted by HRES and the control forecast. Mohamed showed the chart in his daily report on 19 December.
“We aim to identify systematic issues, perform preliminary investigations, and communicate the findings to model developers,” Mohamed says.
Analysts involved in the Forecast Daily Report have expertise in different aspects of ECMWF’s Integrated Forecasting System (IFS). Mohamed’s contribution provides a particular focus on observations.
“This way we cover all aspects of the forecasting system to investigate potential problems,” Mohamed says. “We can thus point researchers to some issues where they should focus their efforts.”