On 14 May 2023, tropical cyclone (TC) Mocha made landfall in Myanmar and impacted Bangladesh. During part of the track, the cyclone was one of the strongest ever in the Bay of Bengal. Significant evacuations were made ahead of the cyclone.
Forecasts of TC Mocha
The cyclone formed on 11 May in the southern Bay of Bengal. The area had a lot of convection in the week before, probably connected to the passage of a Madden–Julian Oscillation at the end of April and an active equatorial Rossby wave in the region. The extended-range forecast from as early as 27 April predicted increased probability of tropical cyclone activity in the Bay of Bengal for 8–15 May (see the first figure). The probability increased in the forecast from 1 May and was consistently above 50% in subsequent forecasts. This makes the genesis of TC Mocha one of the most predictable in recent years.

After the formation of the cyclone, there were still large uncertainties both in terms of the landfall position on the eastern side of the Bay of Bengal and the intensity. The ECMWF ensemble predicted the landfall to be too far north along the coast one to three days before landfall, as can be seen in the example from 12 May 00 UTC. The forecasts also predicted a later landfall than observed, which is a result of a known slow-propagation-speed bias in ECMWF forecasts. With the upgrade of the ECMWF ensemble to 9 km resolution (Cycle 48r1), there is now an increased capability to predict tropical cyclone intensity and to give a better estimate of the uncertainties. As can be seen in the second figure, such an improvement is reflected in the medium-range prediction of intensity in the Cycle 48r1 ensemble. It can also be seen that the trajectory prediction is slightly better in Cycle 48r1 than in Cycle 47r3, which was operational at the time.

Faulty buoy
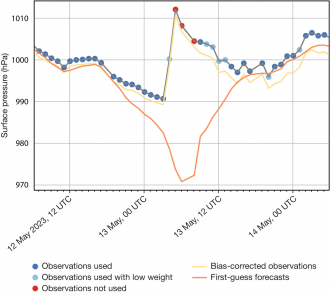
In the forecasts (both operational and pre-operational) from 13 May 12 UTC, i.e. one day before landfall, the cyclone became much weaker, while in reality it continued to increase its strength (see the third figure). The erroneous intensity affected subsequent high-resolution forecasts (HRES) as well as ensemble forecasts (ENS). Investigations afterwards at ECMWF found one meteorological buoy in the path of the cyclone that suddenly reported increasing pressure during the passage instead of decreasing pressure. The buoy was sending observations every hour, meaning that several observations entered the data assimilation. The buoy had been problem-free before the cyclone. Even though observations from the buoy were picked up by the quality control in the data assimilation as problematic, they were used to some degree during the period concerned (see the fourth figure). An experiment afterwards without the buoy confirmed that it was the source of the degraded intensity forecast. Instrument faults during the harsh conditions under a tropical cyclone are very difficult to detect in data assimilation, particularly because we expect large uncertainties in the forecasts, and we want to use as much (good) information as possible from the few available surface observations. But work continues to improve resistance to this type of error.


Conclusion
The case of tropical cyclone Mocha illustrates forecast challenges on different timescales. While the cyclone was relatively predictable regarding the genesis, the medium- and short-range forecasts had difficulties both with track and intensity predictions. This was made worse by the assimilation of the surface pressure from a faulty buoy. Nevertheless, as a result of forecasts from ECMWF and other centres, significant evacuations took place before landfall and likely prevented loss of human life.

