Recently ECMWF has been involved in a project funded by the European Space Agency (ESA) to explore the real-time use of remote observations to improve fire danger forecasts. As a result, a new fire danger index has been proposed to overcome one of the most important limitations of current fire danger metrics: the lack of connection with real-time information on fuel available for burning. The proposed fire occurrence probability index (FOPI) combines the most-used model of fire danger, the Canadian fire weather index (FWI), with remote observations of vegetation optical depth (VOD) as a proxy of fuel amount and moisture. The goal is to improve fire danger predictions in all fuel-limited environments where fire is driven by the short-term drying of intermittently available fuel.

FOPI considerably outperforms the FWI in all arid biomes and has comparable skill to the FWI where fuel is in abundance.
The fire occurrence probability index
To understand how the flammability of a particular area changes in response to weather conditions, and to assess the potential spread and intensity of a fire, fire danger indices such as the FWI are used. These indices express a measure of landscape flammability. Although they do not provide information on actual fires, as they do not consider ignition, they have been shown to correlate with fire activity expressed in terms of burnt area reasonably well.
Fire weather indices are calculated from daily temperature, relative humidity, wind speed and rainfall to simulate the moisture content of the fuel beds at different depths.
One of the most recognised limitations of fire danger indices is that they exclusively rely on weather inputs and disregard the availability of fuel. This leads to very unrealistic results when applied globally. Over deserts, for example, fire danger is usually very high because of the dry conditions, but fires are impeded by the lack of biomass to burn. Static maps are usually applied to mask out barren areas.
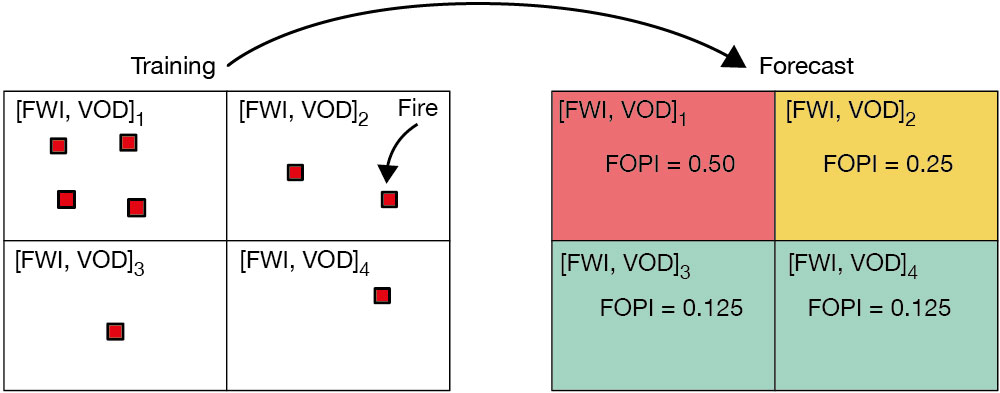
The idea behind the new FOPI index is to improve fire danger forecasts in fuel-limited environments by combining classic fire weather danger with information about fuel and its moisture content. This is done using remote observations of vegetation optical depth. FOPI ‘weights’ FWI predictions by the available fuel: it decreases fire danger where there is very little fuel to burn or where the landscape is too moist to sustain fires, while it retains high fire danger where fuel is abundant and dry.
FOPI is based on a training dataset collected in 2020, when fire activity in terms of burnt areas was referenced to FWI predictions and VOD observations. Using this dataset, FOPI is trained to predict combinations of fire weather conditions (FWI values) and vegetation status (VOD values) that have in the past resulted in detected fire activity (see the FOPI schematic).
The higher the fire activity detected in the past, the higher the FOPI value is for a given combination of FWI and VOD. By construction, FOPI is limited to values between 0 and 1.
FOPI performance in a real case
To provide an idea of how FOPI could help to localise the potential of critical fires in real-time fire monitoring, I analyse an event in 2020. The 2019/2020 Australian summer, since then named Black Summer, produced hundreds of fires, mainly in the southeast of the country. At its peak, air quality dropped to hazardous levels in all southern and eastern states and the smoke could be detected across the South Pacific Ocean to Chile and Argentina.
The second figure shows the calculated FOPI and FWI on a day when fires raged in the Australian state of New South Wales. The localisation of actual fires is performed through recorded burnt areas. A map of observed VOD is also provided to interpret the differences between FOPI and FWI. FOPI is better correlated with the fire activity than FWI. FOPI’s more localised outcome stems from its capability of masking out areas of insufficient fuel load.

Most local authorities are informed of fuel conditions and would be able to exclude areas where fires are not likely to occur despite high FWI. However, the use of FOPI is certainly a great improvement in global systems that aim to provide an overview of fire danger worldwide as it simultaneously takes into account the interannual variability of fuel and its moisture content. These systems are often used at face value without expert interpretation. FOPI can restrict areas in need of further monitoring.
Benefits and future work
The proposed FOPI overcomes part of the limitations that characterise FWI. There are two innovative aspects in FOPI. The first aspect is that, by combining FWI with remote observations of vegetation characteristics, it provides a framework to account for real-time fuel availability. As an immediate benefit, FOPI limits unrealistically high values registered in desert areas where fire activity is hindered. It also makes it possible to retain a memory of previous burning before vegetation recovery takes place. The second advantageous aspect of FOPI is that it expresses a probability of fire occurrence based on previous observations. By explicitly considering the history of burning for a given landscape, FOPI enables landscape susceptibility to be considered.
FOPI can be shown to outperform FWI in all fuel-limited ecosystems while still retaining comparable skill to FWI where fuel is in abundance. The FOPI index thus advances fire danger monitoring globally and to some extent it creates a real-time link with the available fuel in a fire danger forecast. The use of 10-day running mean VOD products implies that FOPI can be issued as a medium-range forecast (1 to 5 days in advance) by applying the same map. The usability of FOPI in extended-range forecasts will, however, require a predictive model for fuel available for burning to be developed, and this is the next step in this research project.
