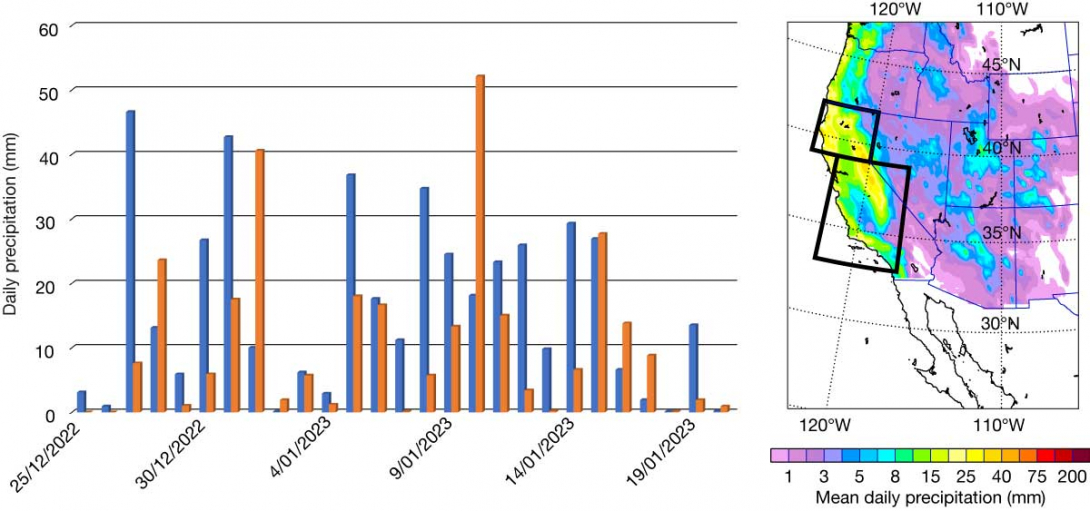
The winter of 2022/2023 was unusually wet in the southwestern US. The first figure shows time-series of daily area-integrated precipitation for two boxes in California from 25 December 2022 up to 20 January 2023, and a map of mean observed precipitation over the period, based on the Prism dataset (https://prism.oregonstate.edu/). During the period, several extreme days can be seen in northern and southern California. This was caused by extratropical cyclones transporting large amounts of moisture – in the form of atmospheric rivers (ARs) – from the sub-tropical Pacific. The impacts of these storms were widespread and included river flooding, large snow amounts, strong winds and high sea waves. In this article, however, the focus will be on precipitation forecasts.

Predictability
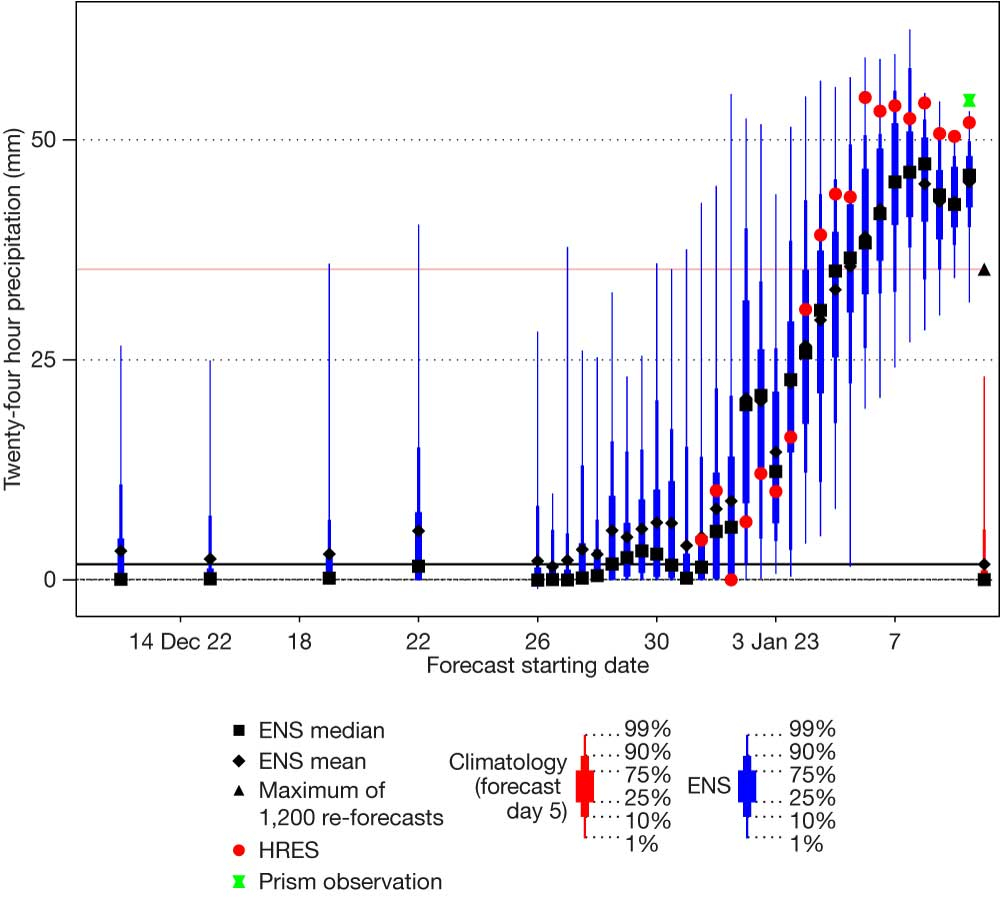
To assess predictability, we consider the most extreme event that occurred during the 24‑hour period ending at 12 UTC on 10 January. We will evaluate the prediction for a relatively large region covering parts of southern California (land points within 33°N–39°N, 122.5°W–117°W, corresponding to the lower box in the first figure). The evolution of the ECMWF ensemble (ENS) and high-resolution forecasts (HRES) for this region and period is visualised in the second figure.

In the extended range, a hint of above-average precipitation in the ensemble mean (shown as black diamonds), compared to the climate mean (shown as a black horizontal line), is visible. The strongest signal in this time range is from 22 December. The signal in the extended range could be connected to the presence of a Madden–Julian Oscillation in phase 6–7, which has been shown to be linked with increased AR activity. In the 10–15 day forecast range, the ensemble mean was again somewhat higher than the climate mean, with the most extreme members above the 99th percentile of the climatology, but this was still not a strong signal.
However, between 12 UTC on 1 January and 00 UTC on 2 January the ensemble shifted toward a more extreme forecast, and for all forecasts from 12 UTC on 3 January (a week before the event) and onwards, the ensemble median is above the 99th percentile of the model climatology. From 00 UTC on 6 January, the ensemble median exceeded the model climate maximum (based on 1,200 re‑forecast members). In conclusion, there was a very strong signal for a large-scale extreme event in medium-range forecasts.
The third figure shows the spatial pattern of the precipitation from the Prism dataset, from an HRES forecast at 12 UTC on 9 January, and from an HRES forecast at 12 UTC on 6 January. All three had comparable mean precipitation inside the box (54.5 mm, 52.0 mm and 53.3 mm respectively). In the observation dataset the main precipitation area was along the coast and in the Sierra Nevada mountain range to the east. The shortest forecast captures the distribution of precipitation rather well, but the precipitation along the coast was somewhat underestimated while the forecast had too much precipitation in the lee of the mountains, which is a sign of too weak an orographic enhancement of the precipitation. For the longer forecasts, the precipitation was shifted more to the north for this case, due to a shift in the synoptic pattern. On average, over the period from 25 December to 20 January, the short-range HRES produced similar precipitation amounts as in the Prism dataset for the southern box, but it had a 5% underestimation for the northern box. A statistical analysis of this type of cases could bring to light whether these errors are due to model biases.

Atmospheric River Reconnaissance: observations and workshop
ECMWF has engaged with the Atmospheric River Reconnaissance (AR Recon) observational campaign for several years. In this campaign, aircraft release dropsondes in dynamically sensitive regions, and additional ocean buoys with pressure sensors are deployed to capture more accurately the mean sea level pressure field across the northern Pacific. At the same time, extra radiosondes were released in California. All these extra data are used in real time in the ECMWF operational data assimilation system.
In June 2023, ECMWF is arranging and hosting the AR Recon workshop in Reading, UK. This event, organised jointly with US colleagues, will bring together current AR Recon participants and interested experts to share results and to coordinate and inspire future work on data collection, data assimilation, metric development and impact assessment. The Research And Operations Partnership approach pioneered by AR Recon will also be discussed.
